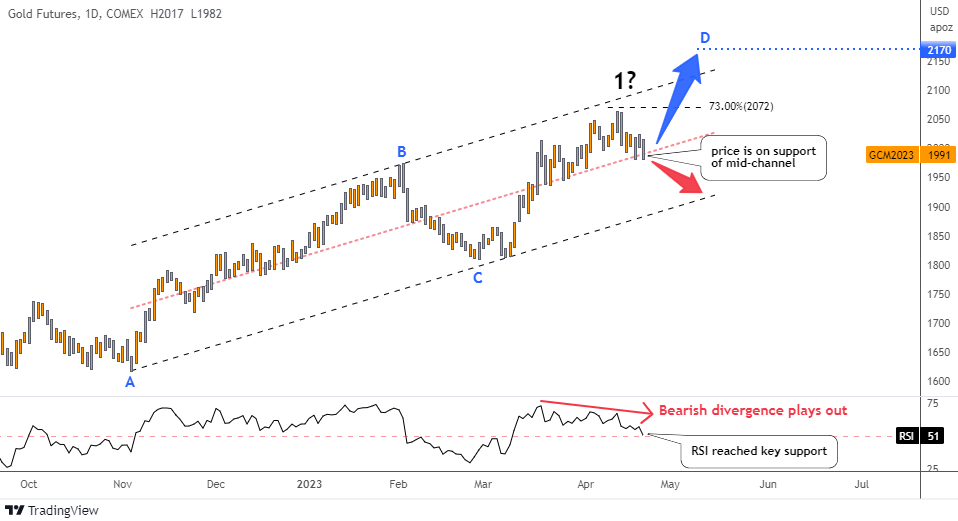
Gold price came very close to hitting the double barrier at $2,070-$2,100 of the black path target and the upper boundary of the bullish trend channel outlined earlier this month. The new 1-year top has been established at $2,063.
You were amazingly accurate this time as most of the votes were for the black path to lead the way. The market has since reversed to the downside, raising the question of whether it was a hard top or a glass ceiling.
To answer this question, let me show you an updated chart below.
In the RSI sub-chart, we can clearly spot a bearish divergence as the falling peaks didn’t confirm the new top in the price chart. This has been playing out, pushing the price down. The indicator’s reading has reached the key support of 50, just like the price.
Let us watch how the price would react at this double edge of the mid-channel and the RSI’s support. The price still could bounce to the upside and challenge the recent top as well as the upside of the trend.
The bearish signal would come on…
Continue reading at INO.com

