There is a commonality between a three-year old on a family car trip and traders and investors. Both groups want to know “Are We There Yet”. While neither three -year olds or traders tend to have much patience, at least the ultimate arrival time is known in advance on a family car trip. The ultimate low is only known after the fact in the stock market.
In my article from several weeks ago, I talked about how option prices can help predict future stock prices, in this case a short-term top. It was a take on the Warren Buffett philosophy of being fearful when others are greedy. Option prices are the embodiment of this notion. When stocks rise, option prices tend to fall and vice-versa.
This is evidenced in the VIX which tends to correlate inversely with the S&P 500. The VXN is a similar measure for the NASDAQ 100 stocks. Both the VIX and VXN are a 30-day measure of option prices.

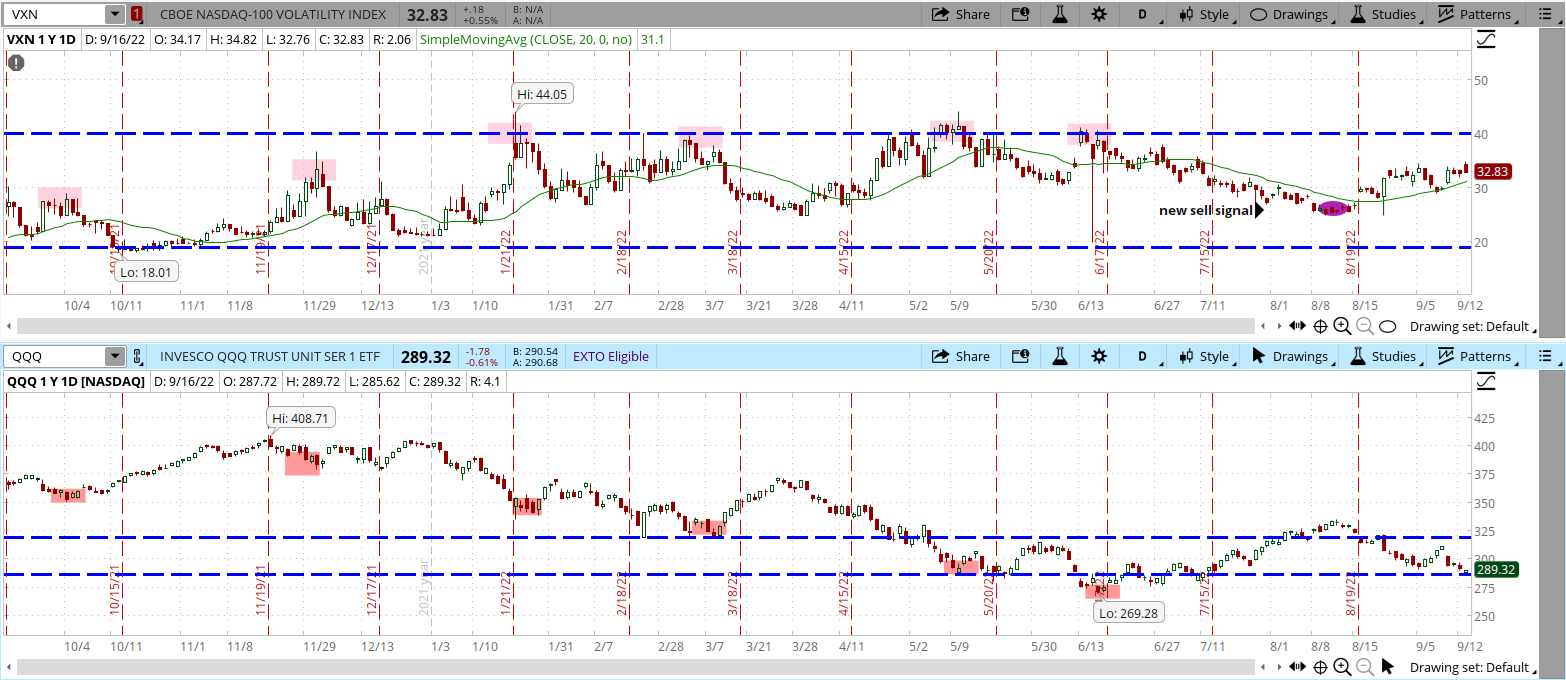
Once again, I will turn to using option prices to give me a clue as to when the market malaise may be getting overdone. Just as the lows in VXN usually point to a pullback, the spike to highs is usually a reliable indication that a short-term bottom may be in the offing. The chart below shows the previous six times over the past year when VXN spiked to highs and then began to head lower
Each instance marked a significant short-term top in the VXN and a meaningful short-term bottom in QQQ. VXN has flattened out recently. It may take meaningful new lows in QQQ to get VXN top explode higher towards the 40 area and a new buy signal.
The last four spikes in the VXN all topped out near the 40 area. That would certainly be a level to consider turning from bearish to bullish on the QQQ. A re-test of the major support level at $290 in the QQQ would be just over a 10% pullback from the recent highs near $325. It would also equate to just about the average drop of…
Continue reading at STOCKNEWS.com
